Microsoft Power BI
Переглядайте й створюйте аналітику у браузері
- Можливості
- Interactive, Read, Write
- Категорія
- Дані
- Розробник
- OpenAI
- Веб-сайт
- (відкривається у новому вікні)
Як це працює
Використовуйте Power BI, сервіс Microsoft Fabric, щоб переглядати звіти, створювати візуальні елементи й публікувати приладні дошки у браузері. Потрібен локальний доступ до браузера в ChatGPT Desktop або версії Codex для комп’ютера; функція недоступна у вебверсії, мобільному застосунку та завданнях, що виконуються у хмарі. Розроблено й підтримується OpenAI. Використовує вебінтерфейс організації та наявні дозволи облікового запису, у який виконано вхід; доступні дії залежать від браузера, випуску продукту й ролі. Підключення через API або MCP не передбачено.
Що ще можна зробити?
Поясніть показники звіту
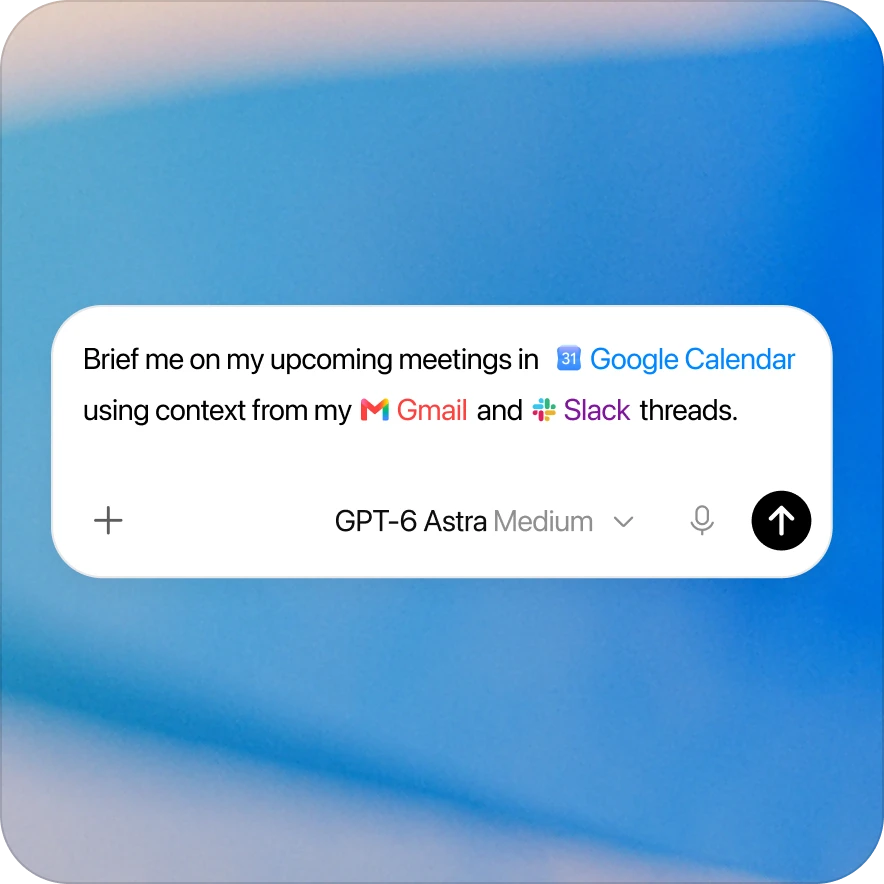
Microsoft Power BI: переглянь звіт про продажі, відкритий у моєму браузері. Поясни його фільтри, визнач найбільші регіональні зміни цього кварталу й підсумуй три найважливіші для нашого огляду висновки.
Створіть аналітичний звіт
Microsoft Power BI: створи звіт із цієї семантичної моделі та закріпи ключові візуальні елементи на приладній дошці.
Зробіть звіт зрозумілішим
Microsoft Power BI: у моєму браузері онови вказаний мною звіт, щоб чіткіше порівняти продажі за регіонами. Добери відповідні візуальні елементи, познач одиниці вимірювання й періоди часу та підсумуй внесені зміни.
Що включає ця пропозиція
Навичка
- power-bi
Ресурси
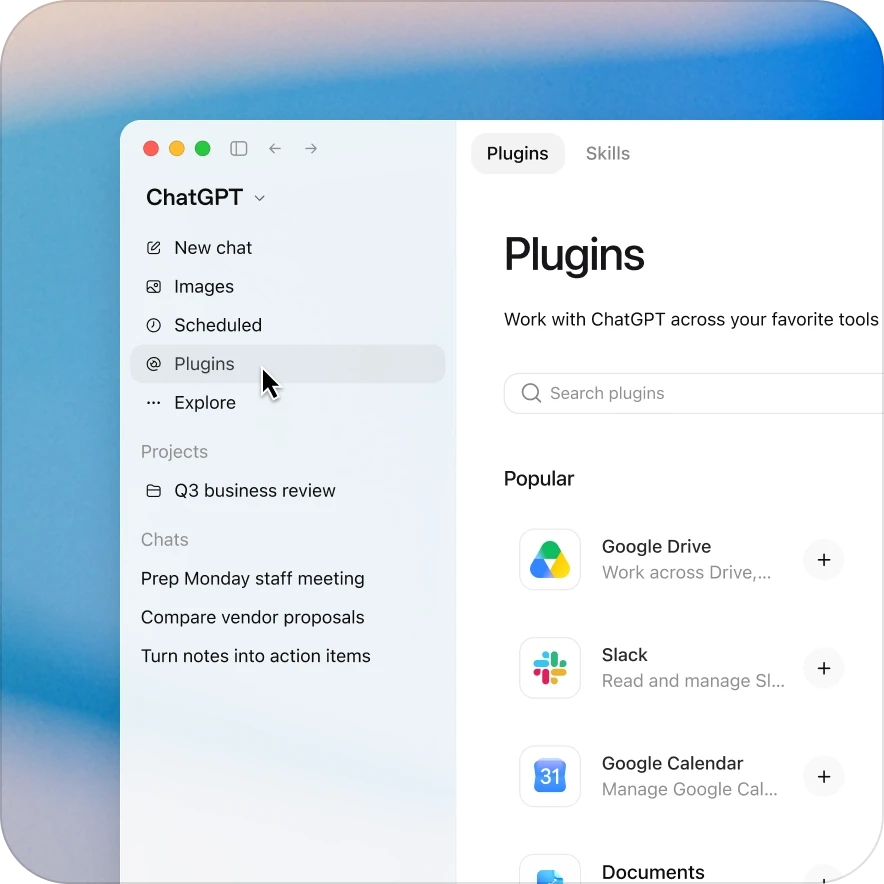
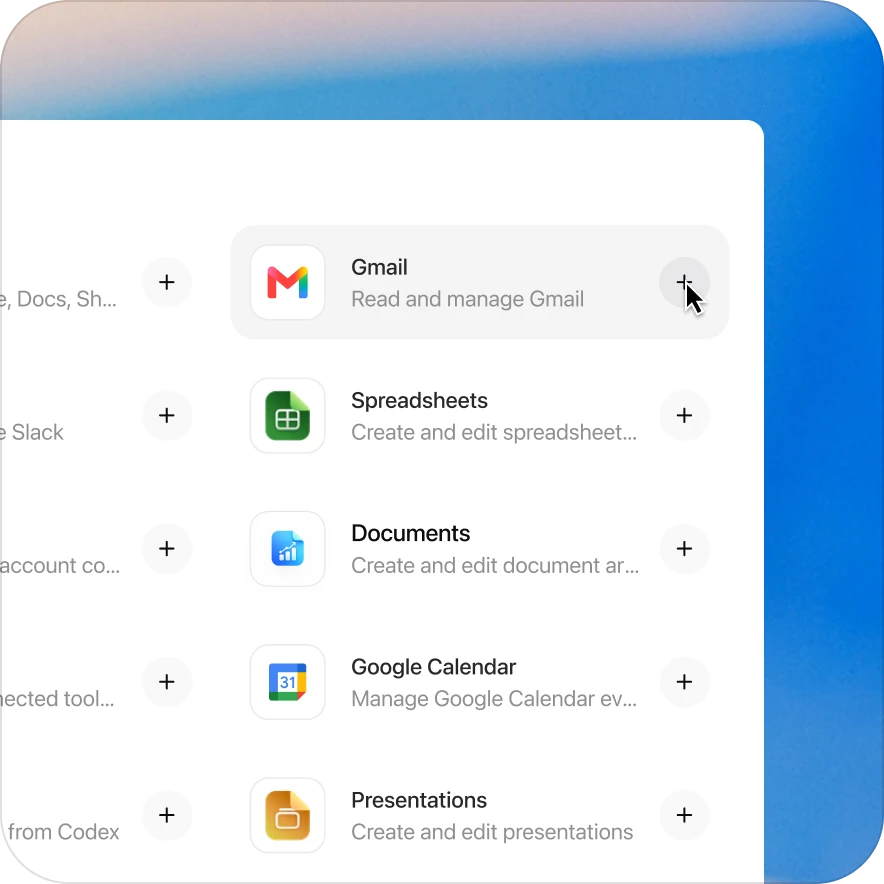
Додайте плагін Microsoft Power BI всього за кілька кліків
Доступність залежить від плагіна, вашого плану та налаштувань робочого простору. Для деяких підключень потрібне налаштування або схвалення адміністратора. Якщо доступ заблоковано, зверніться до адміністратора робочого простору.
Переглянути пов’язані плагіни
Data
Перетворюйте дані на чіткі рішення.
Snowflake
Ставте аналітичні запитання до даних Snowflake із контрольованим доступом.
Databricks Genie
Аналізуйте дані лейкхаусу та інформаційні панелі природною мовою.
BigQuery
Досліджуйте дані BigQuery і створюйте SQL-запити природною мовою.
Alation
Керований рівень знань
DBT
Працюйте з проєктами dbt