Core dump epidemiology: ၁၈ နှစ်ကြာ bug ကို ပြင်ခြင်း
ဒေတာအခြေခံအဆောက်အအုံထဲက ရှုပ်ထွေးသော crash များကို debug လုပ်ရန် population-level analysis အသုံးပြုခြင်း။
OpenAI ၏ မော်ဒယ်များနှင့် အေးဂျင့်များသည် inference အချိန်—မော်ဒယ်က သင့်မေးခွန်းကို စဉ်းစားနေချိန်—သက်ဆိုင်ရာဒေတာရှာရန် scalable data infrastructure ကို ပိုအားထားလာသည်။ ထိုဝန်ဆောင်မှုအချို့ကို C++ ဖြင့် ရေးထားသည်။ စနစ်ကို low-level ထိန်းချုပ်နိုင်သောကြောင့် စွမ်းဆောင်ရည်မြှင့်ပြီး memory သုံးစွဲမှု လျှော့နိုင်သည်။ Scale တိုးရာတွင် ထိုထိရောက်မှုက အရေးကြီးသော်လည်း C++ တွင် memory safety မရှိသဖြင့် bug များက မှားသော သို့မဟုတ် မရှိသော memory address သို့ ရေးပြီး crash ဖြစ်စေနိုင်သည်။
လအနည်းငယ်အကြာက ChatGPT ဒေတာအခြေခံအဆောက်အအုံ၏ အထူးအစိတ်အပိုင်း Rockset ဝန်ဆောင်မှုအတွင်း crash အချို့တွေ့ခဲ့ရပါသည်။ ၎င်းသည် ဒေတာ plugin များစွာနှင့် စကားဝိုင်းရှာဖွေမှုအတွက် အရေးပါပါသည်။ Crash တစ်ခုစီတွင် သာမန် C++ function တစ်ခု ပြီးသွားပြီးနောက် bogus address သို့ return ပြန်သလို ဖြစ်နေပါသည်။ Instruction pointer က code ကို မညွှန်တော့သဖြင့် kernel က program ကို ရပ်လိုက်ပါသည်။ တစ်ခါတစ်ရံ stack frame ရှိ return address slot သည် NULL ဖြစ်နေပါသည်။ တစ်ခါတစ်ရံ stack pointer CPU register ကိုယ်တိုင် 8 bytes လွဲနေပြီး ပုံမှန် execution အလယ်တွင် %rsp ကို တစ်နည်းနည်းဖြင့် decrement လုပ်ထားသလို ဖြစ်နေပါသည်။ နှစ်မျိုးလုံးတွင် return ပြန်ချိန်၌ crash ဖြစ်သွားခြင်းဖြစ်ပါသည်။
ဤသည်တို့သည် application code ၏ ပုံမှန် failure mode မဟုတ်ပါ။ သိမ်းထားသော return address တစ်ခုတည်းကိုသာ ထိသော stray write ဖြစ်နိုင်သော်လည်း အလွန်ရှားသည်။ inline assembly၊ setcontext သို့မဟုတ် longjmp (ကျွန်ုပ်တို့ မသုံးပါ) မပါဘဲ %rsp ကို ၈ ဖြင့် misalign ဖြစ်စေသော bug သည် ပိုထူးဆန်းသည်။ compiled code သည် function prologue နှင့် epilogue တွင်သာ ထို register ကို တိုက်ရိုက်ပြင်သည်။ ကျွန်ုပ်တို့ (သို့မဟုတ် ChatGPT) စဉ်းစားသမျှ hypothesis တိုင်းကို ဆန့်ကျင်သည့် အထောက်အထား ခိုင်မာခဲ့သဖြင့် bug သည် မဖြစ်နိုင်သလို ထင်ရသည်။
တစ်ပြဿနာတည်းဟု ထင်ခဲ့သည်မှာ နောက်ဆုံးတွင် တစ်ချိန်တည်း မတော်တဆတွေ့သော မဆက်စပ်သည့် bug နှစ်ခု ဖြစ်နေသည်။ ပထမမှာ Azure host တစ်ခုပေါ်ရှိ silent hardware corruption ဖြစ်ပြီး CPU က သင်္ချာကို မှန်မှန် မတွက်ခဲ့ပါ။ ဒုတိယမှာ လူသုံးများသော open source library GNU libunwind ထဲမှ ၁၈ နှစ်ကြာ မမြင်ရခဲ့သည့် race condition ဖြစ်သည်။
ဤ post သည် epidemiologist ကဲ့သို့ စဉ်းစားကာ crash အားလုံး၏ အရည်အသွေးမြင့် data set တည်ဆောက်၍ ရှင်းမရသလိုသော crash များကို မည်သို့ရှာပြီး ပြင်ခဲ့သည်ကို ပြောပြသည်။
ပထမ Rockset ကို ပိုနက်နက်ကြည့်ကြမည်။ ၎င်းသည် search နှင့် real-time analytics အတွက် cloud-native data system ဖြစ်ပြီး OpenAI အတွင်း sync connector များအပါအဝင် use case များစွာတွင် သုံးသည် (Rockset ကို ၂၀၂၄ တွင် OpenAI က ဝယ်ယူခဲ့သည်)။ Streaming update များဖြင့် အလုပ်နေရာ၏ knowledge base index ကို လက်ရှိအတိုင်း ထိန်းထားပြီး ChatGPT က မေးခွန်းဖြေသည့်အခါ သို့မဟုတ် action လုပ်သည့်အခါ သက်ဆိုင်ရာအချက်အလက် ရှာနိုင်စေသည်။
Rockset ၏ execution layer ကို C++ ဖြင့် ရေးထားသည်။ C++ သည် CPU ကို low-level access ပေးသဖြင့် performance နှင့် efficiency ကောင်းသော်လည်း application bug များက invalid memory access နှင့် segfault ဖြစ်စေနိုင်သည်။ ၎င်းတို့ကို လိုက်ရန် crash ဖြစ်ချိန် stack trace log ရေးရန် folly ၏ fatal signal handler ကို သုံးပြီး၊ သက်ဆိုင်ရာ core dump (crash ချိန် program state snapshot) ကို နောက်မှစစ်ရန် Azure blob storage သို့ upload လုပ်သည်။ Rockset ၏ query processing leaf အားလုံး replicate လုပ်ထားသဖြင့် crash ၏ client ထိခိုက်မှု လျော့သည်။ သို့သော် segfault တစ်ခုစီသည် reliability နှင့် quality ပန်းတိုင်များအတွက် ပြင်ရမည့် bug ဖြစ်သည်။
အစပိုင်းတွင် ဤ core များကို ပုံမှန် debugging ပြဿနာလို ကိုင်တွယ်ခဲ့သည်: core dump အချို့ကို သေချာစစ်၊ hypothesis ထုတ်ပြီး တစ်ခုချင်း ပယ်ချခဲ့သည်။
Crash အများစုသည် DocumentTree::updateDocument method တွင် ဖြစ်သည်။ ဤ crash များတွင် updateDocument က မသိသော function X ကို call လုပ်၊ X လုပ်ဆောင်နေစဉ် stack ပျက်ပြီး X သည် executable code မဟုတ်သည့် address သို့ return ပြန်သလို မြင်ရသည်။ အချို့တွင် X ၏ ခုနက pop ပြီးသော frame သည် saved return address NULL ဖြစ်သည်မှလွဲ၍ valid သလို မြင်ရသည်။ အခြားကိစ္စများတွင် stack pointer ကိုယ်တိုင် မှားသလို မြင်ရသော်လည်း နောက် valid frame သည် updateDocument ပင် ဖြစ်နေသည်။
Stack ဘယ်ချိန်ပျက်သည်ကို မသိသဖြင့် ရှာရမည့်နေရာ အလွန်ကျယ်ခဲ့သည်။ updateDocument သည် inlining များသော method ကြီးဖြစ်ရာ X အတွက် candidate များ အလွန်များသည်။
ကျွန်ုပ်တို့၏ C++ code ထဲက bug လား။ Compiler သို့မဟုတ် linkage ပြဿနာလား။ Runtime library တစ်ခုထဲက ပြဿနာလား။ Signal delivery သို့မဟုတ် context switching ဆိုင်ရာ Linux kernel bug လား။ ထို့ထက် ရှားသောအရာလား။ Stray write ဖြစ်လျှင် ကျွန်ုပ်တို့၏ ASAN staging environment က ဘာကြောင့် မဖမ်းမိသနည်း။
ပြဿနာဖြစ်ပွားမှုအားလုံးကို application-level log များဖြင့် ရှာရန် ကြိုးစားခဲ့သော်လည်း stack-corruption bug များကို log တစ်ခုတည်းဖြင့် ခွဲရခက်သည်။ log ထဲရှိ stack trace များကိုယ်တိုင် ပျက်နေ သို့မဟုတ် ပျောက်နေသောကြောင့် ဖြစ်သည်။ False positive နှင့် false negative နှစ်မျိုးလုံး မပါသော log query မတည်ဆောက်နိုင်ခဲ့ပါ။ Core များကို လက်ဖြင့် ထပ်စစ်ပြီး ဥပမာအချို့ ထပ်တွေ့ခဲ့သော်လည်း ယုံကြည်ရသော data set ရရန် အလုပ်အလွန်များသည်။
ဤအဆင့်တွင် region များစွာနှင့် hardware type များစွာ၌ crash တွေ့ခဲ့သဖြင့် hardware bug ကို (မှားယွင်းစွာ) ပယ်ချပြီး software-only အကြောင်းရင်းများကို ဆက်ရှာခဲ့သည်။ ရက်အနည်းငယ်ကြာ misaligned-%rsp crash တစ်ခုကို stack နှင့် register contents ဖြင့် crash မတိုင်မီ history ပြန်တည်ဆောက်ကာ အနက်ရှိုင်းဆုံး လိုက်ခဲ့သည်။ သဲလွန်စအချို့ ရခဲ့သော်လည်း bug အားလုံး အကြောင်းရင်းတူသည်ဆိုသည့် ကနဦးကောက်ချက်ကို မလွှတ်နိုင်ခဲ့သဖြင့် မတိုးတက်ခဲ့ပါ။
စုံစမ်းမှု၏ အလှည့်အပြောင်းမရောက်မီ core file များမှ ကျွန်ုပ်တို့ ထုတ်ယူနေသည့် အချက်အလက်ကို ရှင်းပြရန် လိုသည်။
Rockset ကို -fno-omit-frame-pointer ဖြင့် compile လုပ်ထားသဖြင့် active stack frame ကို %rbp မှ အမြဲရောက်နိုင်ပြီး caller များက frame pointer linked list ဖွဲ့သည်။
Linux x86_64 တွင် AMD64 System V ABI က %rsp အောက် 128 bytes ကို red zone အဖြစ်လည်း သီးသန့်ထားသည်။ ထိုနေရာကို userspace code သုံးနိုင်ပြီး ABI contract အရ signal ပို့သည့်အခါ kernel က မဖျက်ဆီးမည်ဟု ကတိပေးထားသည်။
Return ပြီးနောက် crash ကို debug ရာတွင် red zone က အဓိကကျသည်၊ အကြောင်းမှာ return မတိုင်မီ အချက်အလက်အချို့ကို ထိန်းထားသောကြောင့် ဖြစ်သည်။ SIGSEGV trigger ဖြစ်လျှင် folly ၏ fatal signal handler သည် crash ဖြစ်နေသော thread ၏ stack ပေါ်တွင် run သည်။ Active မဟုတ်တော့သော stack frame များ (function return ပြီးသောကြောင့်) သည် နောက်ဆုံး 128 bytes မှလွဲ၍ signal handler ကြောင့် clobber ဖြစ်မည်။ ထို့ကြောင့် “X ၏ ခုနက pop ပြီးသော stack frame သည် NULL return address မှလွဲ၍ valid သလို မြင်ရသည်” ဟု ပြောနိုင်သည်။ Red zone သည် inactive frame အချို့၊ တစ်ခါတစ်ရံ frame တစ်ခု၏ tail ကိုသာ ထိန်းထားသည်။
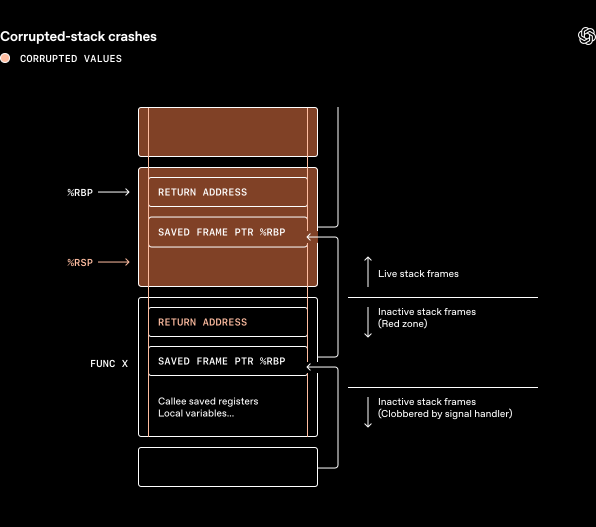
Function အားလုံး အလွန်သေးသော misaligned-stack crash တစ်ခုကို တွေ့ခဲ့သည်။ ထို့ကြောင့် %rsp သည် ရိုးရှင်းသည့် function တစ်ခု execute လုပ်စဉ် misalign ဖြစ်ပြီး နောက်ပိုင်း call များ ဆက်အောင်မြင်ခဲ့သည်ကို မြင်နိုင်ခဲ့သည်။ Active function က နောက်ဆုံး return ပြန်ရန် ကြိုးစားသည့်အခါမှသာ program crash ဖြစ်သည်။ ထို code path များတွင် exception၊ inline assembly၊ setcontext သို့မဟုတ် longjmp မသုံးပါ။ ထို့ကြောင့် core ပြသသလို stack pointer တကယ်ပြောင်းခဲ့ပါက userspace code bug ဖြင့် မရှင်းနိုင်ပါ။
ထို့ကြောင့် kernel ဘက်ကို လှည့်ကြည့်ခဲ့သည်။
Rockset သည် program အများစုထက် signal များကို ပိုပြင်းပြင်းထန်ထန် သုံးသည်။ Query execution ကို data လဲလှယ်သော lightweight task များစွာအဖြစ် ခွဲထားသည်။ ၎င်းသည် high-QPS workload များကို ထိရောက်စွာ ကိုင်တွယ်ရန် အရေးကြီးသော်လည်း query များစွာ၏ work ကို thread pool တစ်ခုပေါ် multiplex လုပ်ထားသဖြင့် per-query CPU accounting ခက်စေသည်။
ကျွန်ုပ်တို့၏ ဖြေရှင်းချက်မှာ coarse_thread_cputime_clock ဖြစ်ပြီး clock_gettime(CLOCK_THREAD_CPUTIME_ID, ...) ကို task boundary တိုင်း sample လုပ်နိုင်လောက်အောင် စရိတ်နည်းစွာ ခန့်မှန်းပေးသည်။ timer_create API ဖြင့် CPU time စုပုံမှုအပါအဝင် အချိန်ကုန်လွန်မှုအယူအဆများအပေါ် မူတည်၍ periodic signal delivery ကို schedule လုပ်နိုင်သည်။ CPU time millisecond အနည်းငယ်တိုင်း signal (SIGUSR2) ပို့ရန် schedule လုပ်ပြီး ထိုအချိန်တွင် signal handler က thread-local value ကို update လုပ်သည်။ Task များစွာသည် execute လုပ်နေစဉ် coarse clock တက်လာသည်ကို မမြင်သော်လည်း delta အားလုံးပေါင်းလျှင် query တစ်ခု၏ အမှန်တကယ် CPU time ကို unbiased estimate ရသည်။
Signal များကို အလွန်မကြာခဏ ပို့သဖြင့် context switching သို့မဟုတ် signal delivery ဆိုင်ရာ ရှားပါး kernel bug ဖြစ်နိုင်သည်ဟု ထင်ရသည်။ Bug report များ၊ kernel source code နှင့် Azure-specific kernel patch များကို ဖတ်ရှုခဲ့သည်။ Stress test များလည်း စမ်းခဲ့သည်။ သက်ဆိုင်သလို ထင်ရသည့် အရာ မတွေ့ခဲ့ပါ။
ထိုအချိန်တွင် နောက်ဆုတ်ပြီး အခြားနည်းလမ်း စမ်းရန် ဆုံးဖြတ်ခဲ့သည်။
ဤပြဿနာမျိုးကို debug လုပ်ရန် နည်းလမ်းကြီးနှစ်ခု ရှိသည်။
တစ်ခုမှာ ဆရာဝန်လို လုပ်ခြင်းဖြစ်သည်: လူနာတစ်ဦးကို အာရုံစိုက်၊ စမ်းသပ်မှုများစွာလုပ်ပြီး အသေးစိတ်အထောက်အထားမှ case တစ်ခုကို diagnose လုပ်ရန် ကြိုးစားခြင်း။
နောက်တစ်ခုမှာ epidemiologist လို လူဦးရေအစုတစ်ခုလုံးကို ကြည့်ပြီး case တစ်ခုတည်းက မပြနိုင်သော pattern များ ရှိမရှိ မေးခြင်းဖြစ်သည်။ Bug သည် release တစ်ခုတွင် စခဲ့သလား။ Hardware SKU တစ်ခု (သတ်မှတ် CPU နှင့် server မော်ဒယ်)၊ region တစ်ခု သို့မဟုတ် kernel version တစ်ခုနှင့် ဆက်စပ်သလား။ Syndrome တစ်ခုတည်းလို မြင်ရသည့်အတွင်း ကွဲပြားသော cluster များစွာ ပုန်းနေသလား။
ကျွန်ုပ်တို့သည် အများအားဖြင့် doctor mode ထဲတွင် ရှိနေခဲ့သည်။ အရေးပါသော အပြောင်းအလဲမှာ အရည်အသွေးမြင့် population data စုရန် လိုသည်ဟု ဆုံးဖြတ်ခြင်း ဖြစ်သည်။
ပြဿနာဖြစ်ပွားမှုအားလုံးကို အလိုအလျောက် ရှာရန် ယခင်ကြိုးပမ်းမှုများ မအောင်မြင်ခဲ့ပါ။ အကြောင်းမှာ log များပေါ်တွင် text search သုံးနေခဲ့သောကြောင့် ဖြစ်သည်။ Core dump များတွင် အချက်အလက် ပိုများသော်လည်း ၎င်းတို့ကို လူကိုယ်တိုင် စစ်ဆေးနေခြင်းက scaleမဖြစ်ပါ။ Core dump များကို အလိုအလျောက် analyze လုပ်နိုင်သည့် pipeline တည်ဆောက်ရန် အားထုတ်ရန် ဆုံးဖြတ်ခဲ့သည်။
Core file တစ်ခုစီ၏ prefix ကို download လုပ်၊ register ထုတ်ယူ၊ log များဖြင့် သိထားသော false positive များကို filter လုပ်ပြီး crash ကို return-to-null၊ misaligned-stack သို့မဟုတ် other ဟု label လုပ်သည့် script ကို ChatGPT ဖြင့် ရေးခိုင်းခဲ့သည်။ ထို့နောက် ယခင်နှစ်၏ production Rockset core dump အားလုံးပေါ်တွင် ထို script ကို parallel ဖြင့် run ခဲ့သည်။
ဤသည်မှာ အလှည့်အပြောင်း ဖြစ်ခဲ့သည်။
သန့်ရှင်းသော data set ရသည်နှင့် correlation များ ချက်ချင်း ပေါ်လာသည်။ ကျွန်ုပ်တို့ ထူးဆန်းသော bug တစ်ခုတည်းဟု ထင်ခဲ့သည်မှာ တကယ်တော့ သီးခြား crash population နှစ်ခု ဖြစ်နေသည်။
Return-to-null core များသည် cluster များစွာနှင့် ဒေသများစွာအနှံ့ ပျံ့နေသည်။ ၎င်းတို့၏ ဖြစ်နှုန်း မကြာသေးမီက တိုးလာသော်လည်း တိကျသော စရက် သို့မဟုတ် ရှင်းလင်းသော အခြေခံအဆောက်အအုံနယ်နိမိတ် မရှိခဲ့ပါ။
Misaligned-stack crash များမှာ လုံးဝကွဲပြားသည်။ အားလုံး region တစ်ခုတည်းမှ လာပြီး စရက်လည်း ပြတ်သားသည်။ ကြာရှည် run နေသော ဆုံမှတ်များပေါ်တွင် မဖြစ်ခဲ့ပါ။ Azure VM (cloud-hosted virtual machine) များစွာ ပါဝင်သော်လည်း pattern အရ hardware မကောင်းသော physical machine တစ်လုံးပေါ် ကျသည့် VM တိုင်းကို ပြဿနာဖြစ်စေသလို မြင်ရသည်။

ထိုအခိုက်တွင် bug နှစ်ခုကို စိတ်ထဲမှာ ရောထွေးနေခဲ့ကြောင်း သိလိုက်သည်။ Bug နှစ်ခုလုံးမှ counterexample များကို ရောနေခဲ့သဖြင့် တစ်သမတ်တည်း ရှင်းပြချက်တစ်ခုကို မတွေ့နိုင်ခဲ့ပါ။
သန့်ရှင်းသော Kubernetes ဆုံမှတ်စာရင်းနှင့် timestamp များ ရှိလာသောကြောင့် misaligned-stack crash များကို physical host တစ်လုံးတည်းအထိ ခြေရာခံနိုင်ခဲ့ပြီး denylist ထဲ ထည့်ရန် လွယ်ကူခဲ့သည်။
ရက်သတ္တပတ်များစွာ stress test လုပ်ပြီးနောက်ပင် ထို host ပေါ်ရှိ register corruption ကို controlled environment ထဲတွင် ပြန်လည်ဖန်တီးနိုင်ခဲ့ခြင်း မရှိပါ။ သို့သော် ပြဿနာရှိသော host ကို service မှ ထုတ်လိုက်သည်နှင့် misaligned-stack crash များ ပျောက်သွားခဲ့သည်။
မကောင်းသော host ကို ဖယ်ရှားခြင်းသည် အမြဲတမ်းဖြေရှင်းချက် မဟုတ်ပါ၊ အကြောင်းမှာ အလားတူပြဿနာ ထပ်မံဖြစ်ပေါ်ခြင်းကို မတားဆီးနိုင်သောကြောင့် ဖြစ်သည်။ သို့သော် အလားတူပြဿနာ ထပ်ဖြစ်ပါက လွယ်ကူစွာ detect လုပ်ပြီး handle လုပ်နိုင်ရန် software ကို ပြောင်းလဲနိုင်သည်။ Core dump မလိုဘဲ log များမှသာ recurrence ကို detect လုပ်နိုင်ရန် register state ထည့်သွင်းပေးသည့်အနေဖြင့် fatal signal handler ကို တိုးတက်စေခဲ့သည်။ VM များကို recycle လုပ်မည့်အစား ပုံမှန်အားဖြင့် reuse လုပ်ရန် control plane ကို ပြောင်းလဲခဲ့ပြီး ၎င်းက ကျွန်ုပ်တို့၏ infrastructure stack အဆင့်တွင် bad-node detection ကို ပိုမိုလွယ်ကူစေသည်။ ဤဖြစ်နိုင်ခြေကို ထည့်သွင်းရန် ကျွန်ုပ်တို့၏ runbook များ (နှင့် အဖွဲ့၏ mental မော်ဒယ်များ) ကိုလည်း update လုပ်ခဲ့သည်။
Bad-host crash များကို ခွဲထုတ်ပြီးနောက် ကျန်ရှိသော return-to-null core များကို စဉ်းစားရှင်းလင်းရန် ပိုမိုလွယ်ကူလာသည်။ ယခင်က exception အသုံးမပြုကြောင်း သေချာသည့် code path များတွင် crash ဖြစ်သည့် counterexample များ ရှိသည်ဟု ထင်ခဲ့သောကြောင့် exception unwinding ကို ပယ်ချခဲ့သည်။ သို့သော် ထို counterexample အားလုံးသည် hardware-corruption cluster မှ ဖြစ်သည်။
ကျန်ရှိသော core များကို ထိုအချက်ကို ထည့်သွင်းစဉ်းစား၍ ပြန်ကြည့်လိုက်သောအခါ ဤကောက်ချက်သည် တိတိကျကျ ပြောင်းပြန်ဖြစ်ကြောင်း တွေ့ရသည်: crash အားလုံးသည် exception unwinding အတွင်း ဖြစ်နေခဲ့သည်။
C++ က exception တစ်ခု throw လုပ်သောအခါ runtime သည် မည်သည့် catch block က ၎င်းကို လက်ခံရမည်နှင့် လမ်းကြောင်းတစ်လျှောက် မည်သည့် destructor သို့မဟုတ် cleanup handler များ run ရမည်ကို ရှာဖွေရသည်။ Compiler က ဤ metadata ကို emit လုပ်သော်လည်း အမှန်တကယ် matching သည် runtime တွင် dynamic အဖြစ် ဖြစ်ပေါ်သည်။
Exception unwinding ကို throw ကို invoke လုပ်သည့် function က အမှန်တကယ် လုပ်ဆောင်ခြင်း မဟုတ်ဘဲ ထွက်လာသော compiled code က call လုပ်သည့် helper function များက လုပ်ဆောင်သည်။ ထို runtime routine များသည် stack ကို စစ်ဆေး၊ stack ပေါ်တွင် တွေ့ရသော function များအကြောင်း metadata ကို ရယူ၊ cleanup handler နှင့် catch block များကို dynamic အဖြစ် ရှာဖွေပြီး ထိုနေရာများထဲမှ တစ်ခုသို့ control ကို transfer လုပ်သည်။ Control transfer လုပ်ခြင်းတွင် ကြားရှိ stack frame အားလုံး (helper function များ၏ frame များအပါအဝင်) ကို unwind လုပ်ခြင်း ပါဝင်သည်။
Operational အရ ၎င်းသည် ပုံမှန် call နှင့် return ထက် longjmp သို့မဟုတ် fiber switch နှင့် ပိုမိုဆင်တူသည်။ Callee save register များအပြင် stack frame register %rbp နှင့် %rsp တို့ကိုလည်း restore လုပ်ရမည်။
ကျွန်ုပ်တို့၏ binary သည် C++ exception unwinding လုပ်ဆောင်သည့် function များ၏ implementation များ ပါဝင်သော library နှစ်ခု—libgcc နှင့် GNU libunwind—နှင့် link လုပ်ထားသည်။ Dynamic linker က ရွေးချယ်ခဲ့သော definition များမှာ GNU libunwind ၏ definition များ ဖြစ်သည်။ ၎င်းက ကျွန်ုပ်တို့ကို အံ့အားသင့်စေခဲ့သည်; symbol versioning rule များကြောင့် libgcc implementation က အနိုင်ရမည်ဟု မျှော်လင့်ထားခဲ့သော်လည်း running binary များကို စစ်ဆေးကြည့်ရာ ထိုသို့ မဟုတ်ကြောင်း တွေ့ရသည်။
ဤအချိန်တွင် bug တစ်ခုတည်းသာ ရှိသည်ဟု ထင်ခဲ့စဉ်က ပြုလုပ်ထားသော အခြား assumption တစ်ခုကို လျှော့ချလိုက်သောကြောင့် ကျွန်ုပ်တို့၏ working hypothesis ပြောင်းလဲသွားသည်။
ကျွန်ုပ်တို့ မြင်နေခဲ့သည်မှာ သာမန် function return to NULL မဟုတ်နိုင်ပါ။ ဖြစ်နိုင်သည်မှာ control မလွှဲပြောင်းမီ destination instruction pointer သည် NULL ဖြစ်သွားသော unwind transfer—တကယ်တော့ setcontext-style register restore—ကို မြင်နေရခြင်း ဖြစ်နိုင်သည်။ တစ်နည်းအားဖြင့် stack ပေါ်ရှိ return address slot မှားခြင်းမဟုတ်ဘဲ unwind library မှ မှားယွင်းသော data ဖြစ်သည်။
ထိုအရာက ပြဿနာကို အလွန်ကျဉ်းသွားစေခဲ့သည်။ GNU libunwind သည် မှားယွင်းသော destination state ကို တွက်နေခြင်း ဖြစ်နိုင်သည်၊ သို့မဟုတ် မှန်ကန်သော state ကို တွက်ပြီးနောက် ၎င်းကို apply မလုပ်မီ တစ်စုံတစ်ခုက ပျက်စီးစေခြင်း ဖြစ်နိုင်သည်။
GNU libunwind source ကို ဖတ်ရာ ၎င်းသည် stack ပေါ်တွင် ucontext_t တစ်ခုကို synthesize လုပ်၊ cleanup handler ၏ frame အတွက် လိုချင်သော register state ကို ဖြည့်ပြီး ထို struct သို့ pointer တစ်ခုကို internal assembly routine ဖြစ်သော _Ux86_64_setcontext သို့ လွှဲပေးသည်ကို တွေ့ခဲ့သည်။
ဤအချိန်တွင် ကျွန်ုပ်တို့တွင် အပိုင်းအစအားလုံး ရှိနေခဲ့ပြီ။
Synthesize လုပ်ထားသော ucontext_t သည် _Ux86_64_setcontext က ထို function execute လုပ်နေစဉ် unwind လုပ်သည့် stack frame များထဲမှ တစ်ခုတွင် နေထိုင်သည်။ _Ux86_64_setcontext သည် %rsp ကို ပြောင်းလဲပြီးနောက်၊ ထိုအချိန်တွင် struct သည် active stack ၏ အစိတ်အပိုင်း မဟုတ်တော့သည့်အခါ struct မှ ဖတ်နေသလား။ ထိုသို့ဖြစ်ပါက ကျွန်ုပ်တို့၏ မကြာခဏဖြစ်သော SIGUSR2 ကဲ့သို့ signal delivery ကြောင့် clobber ဖြစ်ရန် vulnerable ဖြစ်သွားမည်။
အဖြေမှာ ဟုတ်သည်။
ကျွန်ုပ်တို့ အသုံးပြုနေသည့် GNU libunwind version ထဲရှိ _Ux86_64_setcontext ၏ နောက်ဆုံး instruction ခြောက်ခုမှာ အောက်ပါအတိုင်းဖြစ်ပြီး အများစုမှာ memory မှ destination register သို့ load လုပ်သည့် mov instruction များ ဖြစ်သည်:
(%rdi သည် stack တွင် allocate လုပ်ထားသော ucontext_t ကို ညွှန်ပြီး UC_MCONTEXT_* macro များသည် register တစ်ခုစီ သိမ်းထားသည့် fixed offset သို့သာ expand လုပ်သည်။)
ပထမ instruction သည် race window ၏ အစဖြစ်သည်။ ၎င်းသည် %rsp ကို active stack ၏ bottom အသစ်သို့ ညွှန်ရန် update လုပ်သည်။ ဤအရာ ဖြစ်သည်နှင့် %rdi က ညွှန်သော struct သည် active stack (သို့မဟုတ် red zone) ၏ အစိတ်အပိုင်း မဟုတ်တော့ဘဲ kernel အတွက် off-limits မဟုတ်တော့ပါ။
ပုံမှန်အားဖြင့် ဤသည် ပြဿနာ မဖြစ်စေသော်လည်း signal တစ်ခုသည် အတိအကျ မှန်ကန်သော (မှားယွင်းသော?) အခိုက်အတန့်တွင် ရောက်လာပါက kernel သည် signal frame ကို %rsp-128 တွင် တည်ဆောက်မည်။ ၎င်းက %rdi က ညွှန်သော memory ကို overwrite လုပ်နိုင်သည်။
နောက် instruction က UC_MCONTEXT_GREGS_RIP(%rdi) ကို မဖတ်မီ ထိုသို့ဖြစ်ပါက restore လုပ်ထားသော instruction pointer ပျက်စီးနိုင်သည်။ ကျွန်ုပ်တို့၏ crash များတွင် ၎င်းသည် NULL ဖြစ်သွားခဲ့သည်။
အဲဒါက bug ဖြစ်သည်။
This assembly also explains one of the observations that confused us: why function X had a NULL in the return address slot of the preceding stack frame.
setcontext was written to restore all registers, including %rdi, so it can’t use that register to read UC_MCONTEXT_GREGS_RIP(%rdi) at the final moment of the control transfer. Instead, it reads the value earlier, saves it to the stack, restores a few more registers, then uses retq to read the saved value and transfer control.
What looked in the cores like “a function returned to NULL” was actually “the unwinder synthesized a target return address on the stack, but that target had been corrupted before the transfer completed.” We had assumed that corruption of the return address slot must happen in-place, because we didn’t know of any places where (corruptible) data was written to the return address slot on purpose.
What makes this bug seem absurd is how narrow this race window is. In this kind of race condition, the external event (the signal) needs to happen in between two steps taken by another thread. The closer those steps are to each other, the less likely the race condition is to happen.
In this case the vulnerable window is literally one instruction wide! A signal must be delivered after %rsp has been changed, but before the next instruction loads %rip. Several simple instructions like this can be run per cycle on a modern super-scalar out-of-order CPU, so the race window is roughly a hundred picoseconds.
When we found this race, our first reaction was that it must be too rare to explain the observed crash rate. We were seeing more than a dozen return-to-null crashes per day across the fleet. Could a one-instruction race during exception cleanup really account for that?
We turned to Fermi estimation. If the vulnerable window is on the order of seconds and SIGUSR2 arrives every seconds of CPU time, then each exception cleanup handler or catch block has a roughly probability of losing the race.
Rockset uses exceptions as part of its internal ingest backpressure mechanism. A single overloaded host can throw on the order of exceptions per second. That implies the mean time between failures of a host using backpressure is seconds, or one crash every few hours. At fleet scale, that is more than enough to explain the observed crash frequency.
The GNU libunwind bug is old—more than 18 years old, present in the first x86_64 version that supported C++ exception unwinding.
So why did it show up now?
The crash rate is roughly proportional to how many exceptions are thrown and how many signals are delivered. It’s also dependent on how much stack the signal handler consumes.
Rockset is unusual on all three axes. We throw exceptions at high rates as part of normal overload control; we deliver SIGUSR2 unusually often because of coarse_thread_cputime_clock; and earlier this year we made the SIGUSR2 handler use more stack by adding a call to timer_getoverrun, so we could account for merged signals.
That last change seems to have been important. If the handler uses little enough stack, it may not reach and overwrite the stale ucontext_t memory. Before that change, we do not observe these crashes at all. After the change the rate remained low until we ramped up load for some use cases that stressed the backpressure mechanism.
In other words, the libunwind bug has always been there, but the product of our exception rate, signal rate, and handler stack usage had only recently crossed the threshold where it became operationally visible.
This mechanism also explains the coincidence that both the hardware bug and the libunwind bug crashed mostly inside DocumentTree::updateDocument. Crashes from libunwind were heavily biased toward this method, because it’s always active at the point we throw an exception to apply ingest backpressure. It was also heavily selected for the %rsp-misalignment crashes because the bad hardware node was of a SKU that we use for bulk ingest, which spends the majority of its CPU time in that method.
Our immediate mitigation was to switch from GNU libunwind to libgcc’s unwinder. That was a good trade on its own: libgcc’s implementation has benefited from a lot of work to reduce lock contention, which matters when scaling to large VMs.
We also upstreamed a self-contained reproducer and a fix(ဝင်းဒိုးအသစ်တွင် ဖွင့်မည်) to GNU libunwind, and verified that the other unwinders don’t have a similar issue.
This debugging journey taught us a lot about the specific details of dynamic linking, DWARF unwind metadata, Linux signal delivery, the System V ABI, and C++ exception machinery. But the main lesson was simpler than any of that.
The most important step was not the clever assembly reading or deep knowledge of the details. It was building a high-quality data set. In the absence of this data set, we were mixing two distinct phenomena into one story and trying to reason our way out of the confusion. Once we had accurate and complete population data, the structure of the problem became obvious: one crash population belonged to a bad host, and the other belonged to a race in libunwind. Once the data got better, the debugging got easier.
For infrastructure systems like Rockset, that matters a lot. This investigation reinforced our commitment to deep instrumentation, automated investigations, and continual improvements in our operational tooling. Reliability is not just about fixing bugs after they happen—it’s about building the data, workflows, and skills that turn impossible problems into diagnosable and solvable ones.
ရေးသားသူများ
By Nathan Bronsonနှင့် Member of Technical Staff